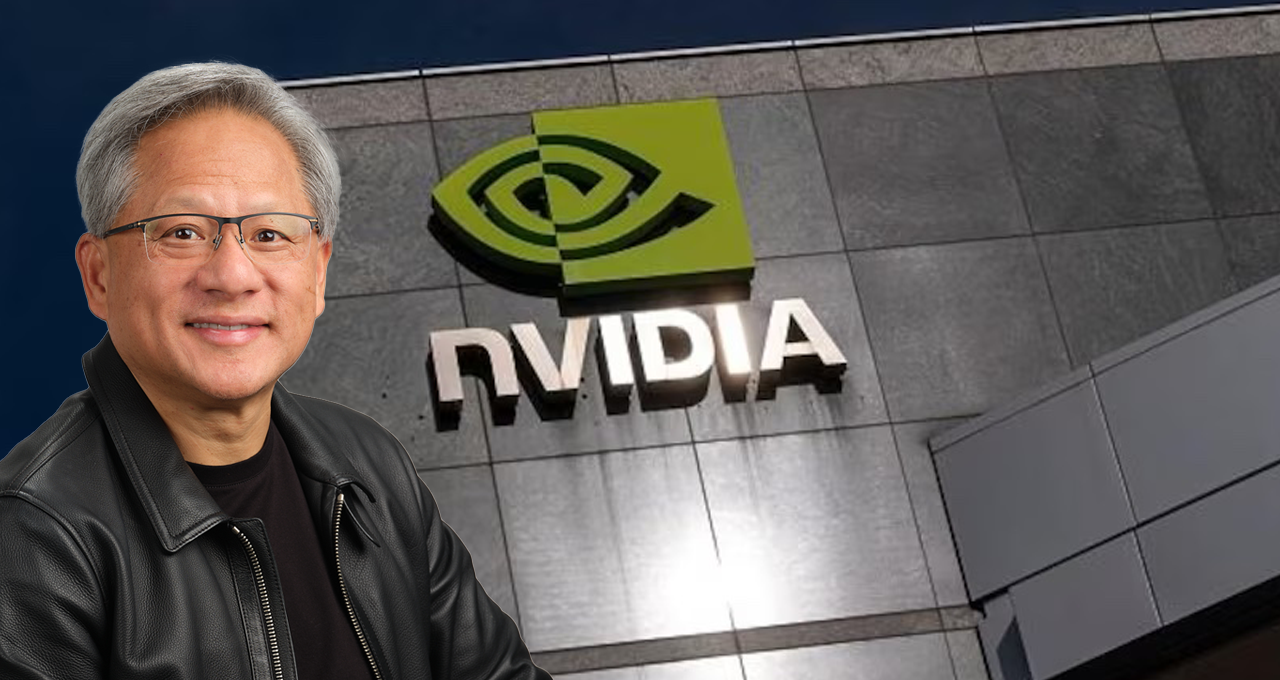
Nvidia’s 13% Stock Rout Has Traders Scouring Charts for Support


In a dramatic turn of events, Nvidia Corp. experienced a staggering $430 billion selloff over a three-day period, prompting traders and investors to delve deep into technical analysis to gauge where the stock might find support. This significant decline, amounting to a 13% drop, came on the heels of Nvidia briefly surpassing Microsoft Corp. as the world’s most valuable company, marking the stock’s first technical correction since April.
Nvidia’s recent selloff has raised eyebrows, particularly given the preceding wave of positive news, including a 10-for-1 stock split and its ascension to the top of the global market cap rankings. Buff Dormeier, chief technical analyst at Kingsview Partners, highlighted this juxtaposition as a concern, pointing to classic signs of capitulation. According to Dormeier, the $115 level represents a crucial short-term support area, with a more significant support level looming at $100.
Technical analysis, though not an exact science, serves as a valuable tool for traders looking to navigate the stock market’s volatility. For Nvidia, the $115 level is notably close to a key Fibonacci retracement level. This method, favored by technical analysts, involves identifying potential support or resistance levels based on the retracement of prior price movements. Specifically, the 38.2% retracement from Nvidia’s intraday low in April to its peak last week lies just about 2% below Monday’s closing price.
Despite the recent drop, Nvidia’s stock remains up 139% for the year, driven by the insatiable demand for its AI-centric chips. The company’s shares surged 43% from the announcement of its May 22 earnings report and stock split until the June 18 peak, at which point Nvidia’s market value reached an astounding $3.34 trillion, temporarily eclipsing Microsoft.
Ari Wald, head of technical analysis at Oppenheimer, maintains that the broader trend for Nvidia is still strong. The stock continues to trade significantly above its 50-day moving average of around $101 and its 100-day moving average of $92. According to Wald, major tops in stock markets typically occur through a gradual process, characterized by multiple buying and selling waves and a subsequent failure to hold key support levels. Wald asserts that Nvidia has not yet exhibited such a pattern, indicating that the long-term uptrend remains intact.
While Wald is optimistic about Nvidia’s long-term trajectory, he, like Dormeier, monitors the $100 support level closely. Bruce Zaro, chief technical strategist at Granite Wealth Management, echoes this sentiment, noting that a drop below $100 would warrant caution. Zaro emphasizes that although a breach of the $100 level might not have dire long-term consequences, it would suggest a period of heightened market volatility, especially in the context of looming election uncertainties and potential Federal Reserve actions on interest rates.
Nvidia’s recent stock performance serves as a stark reminder to investors that even the market’s hottest trades are not immune to sudden reversals. This reality check extends beyond Nvidia, as evidenced by recent developments in other tech giants and the broader market.
For instance, Bitcoin, another high-flying asset, has also exhibited significant volatility, underscoring the unpredictable nature of market trends. Additionally, the tech sector continues to experience dynamic shifts, with companies like Apple Inc. and Meta Platforms Inc. making strategic decisions that ripple through the market. Apple’s rejection of Meta’s AI chatbot integration proposal is a case in point, highlighting the competitive and rapidly evolving landscape of the tech industry.
In summary, Nvidia’s recent 13% stock rout has put traders and investors on high alert, prompting a deeper reliance on technical analysis to identify potential support levels. While the $115 and $100 levels are crucial in the short term, the broader market context and Nvidia’s underlying growth story suggest a resilient long-term outlook. As the market grapples with volatility and uncertainty, Nvidia’s journey serves as a poignant reminder of the complexities and challenges inherent in stock market investing.
Nvidia’s stock may have stumbled, but its story is far from over. For traders and investors, the key lies in staying informed, leveraging technical analysis, and maintaining a long-term perspective amidst the market’s ever-changing dynamics.
